


#47 Music NFTs: the Mint, the Flip, and the Lifetime. ETH Merge Misconceptions.

Disclaimer: Everything we write in "The Crypto Insider Report" is an x-ray of the industry as we see it, through the lens of publicly available information. We are not financial advisors.
ETH Merge Misconceptions
With the hype around Ethereum’s merge so strong, there is a lot of inaccurate stuff floating around - things such as the staking APR increase, faster transactions and, my favorite, lower gas fees. To clarify things, a FAQ-style page was posted on the official Ethereum website, addressing the key misconceptions about the merge. I will highlight them here, starting with the most important ones for retail:
Reduced gas fees: not the case - the consensus mechanism will be changed, without any impact in network capacity.
Faster transactions: no significant change here either, as the rate at which blocks are produced will be practically the same.
Staking APR post merge: while some articles & tweets claim something like a 3x increase of the rewards rate, the estimate is closer to a 50% increase.
Withdrawals after the merge: right now, staked ETH cannot be withdrawn and that will be the case as well after the merge. The website mentions it will remain locked for at least 6-12 months following the Merge.
Everybody will mass-withdraw when they will be able to: won’t be the case, as there are rate limiting mechanisms in place to ensure the security of the network.
Validators not receiving any liquid rewards: while the staking rewards can’t be withdrawn (see above), the tips received for the transactions will be liquid.
Downtime: the merge is designed as a zero downtime transition (and this is in big part what makes it a nontrivial endeavor).
32 ETH for running a node: that is actually only true for block-producing nodes. You can run a non-block-producing node without any ETH. Details here.
The linked page has more details in case you want them. For extra reading, you can check out the ConsenSys blog for more myth busting.
Mihnea
================
Governance tokens - why bought vs. earned influence matters
In today’s edition, I provide an overview and a recommendation to read Alana Levin’s piece on Designing governance tokens. Alana Levin is an Investment Partner at Variant Fund, a fund that regularly shares insightful web3-related think pieces.
In this material, Alana outlines a framework for designing governance tokens. She puts 3 key topics on the table for a team to decide upon:
Does a project resemble a corporation or a country?
Level of control that a team is willing to grant to governance tokens
The need to launch a token
Corporation vs. Country
This one sits at the top of the decision tree in her vision. Teams’ answer to this question would in large part determine whether governance tokens are acquired via capital or non-financial contributions. Thus, corporations are profit-seeking by nature and the motivations among governing parties are primarily financial, so in this system financial capital would be better suited to accumulate influence. On the other hand, countries have a more pluralistic set of values and tokens can be obtained via contributions, for example.
Level of control
Given the liquidity of governance tokens, web3 projects might soon be exposed to the risks of attack vectors predominant in public entities - shareholder activism, hostile takeovers, etc. A project would need to develop defense tactics and decide on limiting the set of decisions governable by tokens. On the earned tokens side (those through contributions, for example) the bar for entry is much higher. Influence may be gained over longer periods of time after an entity shows its commitment to the project’s goals.
The need for a governance token
The fact is that projects can gather community input w/o granting governance rights. However, tokens are a key method to give ownership, motivate and forge a user / owner symbiosis. In the long-run, community-driven networks create more robust and thriving ecosystems. The design space for crafting new ownership experiences remains an open frontier, with some of the current iterations including: community- or events- access, yield distribution, shared security, decision-power, etc.
Below is an overview of the framework that Alana suggests:

Razvan
================
Music NFTs: the Mint, the Flip, and the Lifetime
In order to evaluate and compare various NFT drops and launches over time, Water & Music has examined secondary sales and trade behavior for a number of major, multi-edition music releases.
Several Methods were used:
NFTs that were sold as fixed-price, multi-edition drops.
The majority of drops (1,597) in their database are actually multi-edition.
Drops that sold out in primary sales.
Drops that were at least a month old as of May 1, 2022.
Drops that featured only one main music artist.
Drops whose primary and secondary sales activity could be verified on-chain.
The criteria they utilized to evaluate the mentioned music NFT drops can be loosely divided into three categories: summarizing income statistics, tracking collector behavior, and assessing speculative activity.
A. Summary stats: Overall secondary sale revenue & sale prices
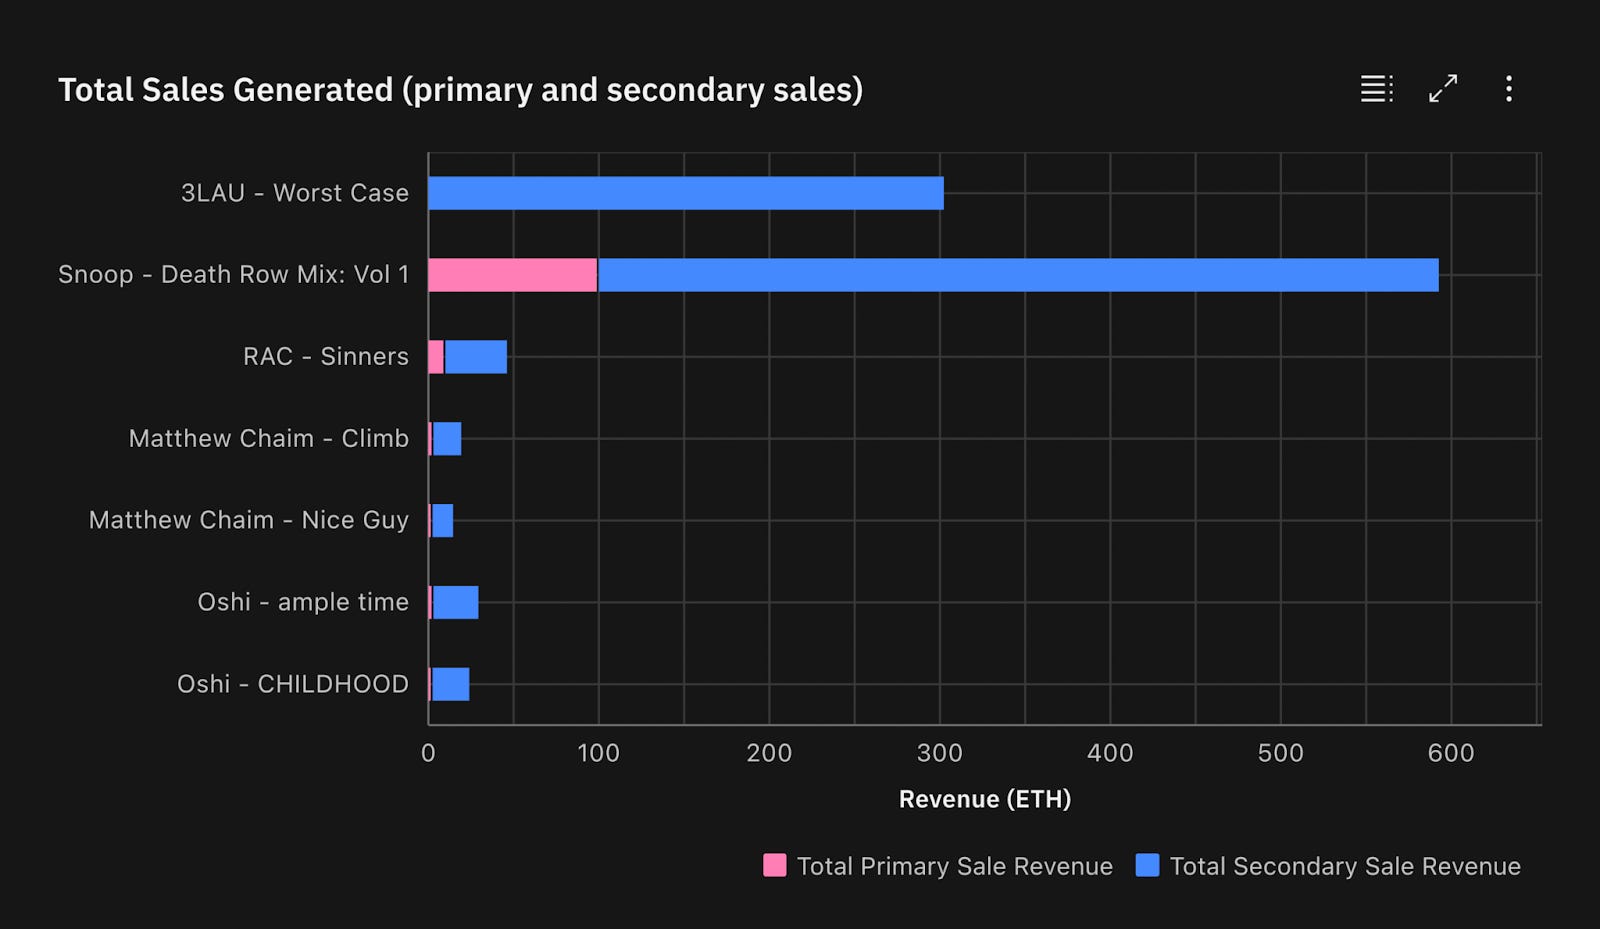
Secondary sales statistics usually exceeded the initial money generated by primary sales in the drops that we studied. The utilization of fixed-price offerings for multi-edition drops may contribute to some of this by allowing initial pricing to fall in relation to market demand (as opposed to auctioning mints to the highest bidder from the jump).
For example, Sound has thus far kept a consistent primary sale price of 0.1 ETH per NFT across all drops. When we’re talking about the secondary sales, oshi's CHILDHOOD drop sold for an average secondary sale price of 2.06 ETH, while Snoop Dogg's Death Row Mix: Volume 1 brought in an average secondary sale price of 0.34 ETH, keeping the range in between.

The only drop we looked at where secondary sale revenue has not yet eclipsed main sale revenue is Monte Booker's Kolors drop via Soulection
(26 ETH versus 40 ETH, respectively).
B. Collector activity: How many people end up participating in an NFT drop at each stage?
Unique wallets involved in primary sales,
Number of editions,
Ratio of unique minting addresses to editions (minter: edition)
Ratio of transfers to sales (transfer: sale)
Ratio of unique sellers to buyers (seller: buyer)

There are 668 wallets that are minting 1,000 editions since Snoop Dogg's drop. It seems that Soulection had a tougher time preventing repeat purchases than the more well-known platforms of Sound and Royal: 286 unique addresses minted 500 editions or nearly two on average per wallet.
In Monte Booker's situation, a seller-to-buyer ratio of less than 1:1 resulted from numerous persons minting and reselling multiple copies of the NFT to a larger pool of purchasers (1:0.96). A 1:1 ratio would indicate that each seller ultimately sells to a single buyer, and neither the collector ecosystem of editions nor its composition would get more concentrated nor less diluted.
The other end of this scale is best represented by Matthew Chaim's second Sound drop. Editions of this drop are becoming very concentrated compared to the starting state of 30 unique addresses for 30 unique editions during primary sales, with a seller: buyer ratio of over 2. A closer look reveals that one wallet (degendavinci.eth) purchased 11 editions of this drop, significantly contributing to this consolidation. Even while these NFTs don't reflect any kind of ownership similar to how stocks in a public company may operate, this kind of behavior is obviously something to watch in cases where NFT ownership has some kind of influence, as when it adds more votes to the DAO's governance.
C. Gauging speculation
D. Artist-level performance over time
We still have C and D to cover and some nice conclusions about what is happening in the Music NFTindustry, but this is for another time.
See you next week.
Cosmin
================
Top 10 Brand with Revenues from NFTs
Crypto analytics site Dune, recently released an NFT brand case study that looked at the performance of large brands’ NFTs on the Ethereum network. The top was led by Nike with $185.32m Total NFTs Revenue, followed by Dolce & Gabbana ( $25.65m) and Tiffany ($12.62m). The reason for Nike ranking so high is its acquisition of the RTFKT NFT firm, which already had a track record and the CloneX collection, which accounts for more than 40% of Nike’s royalties.
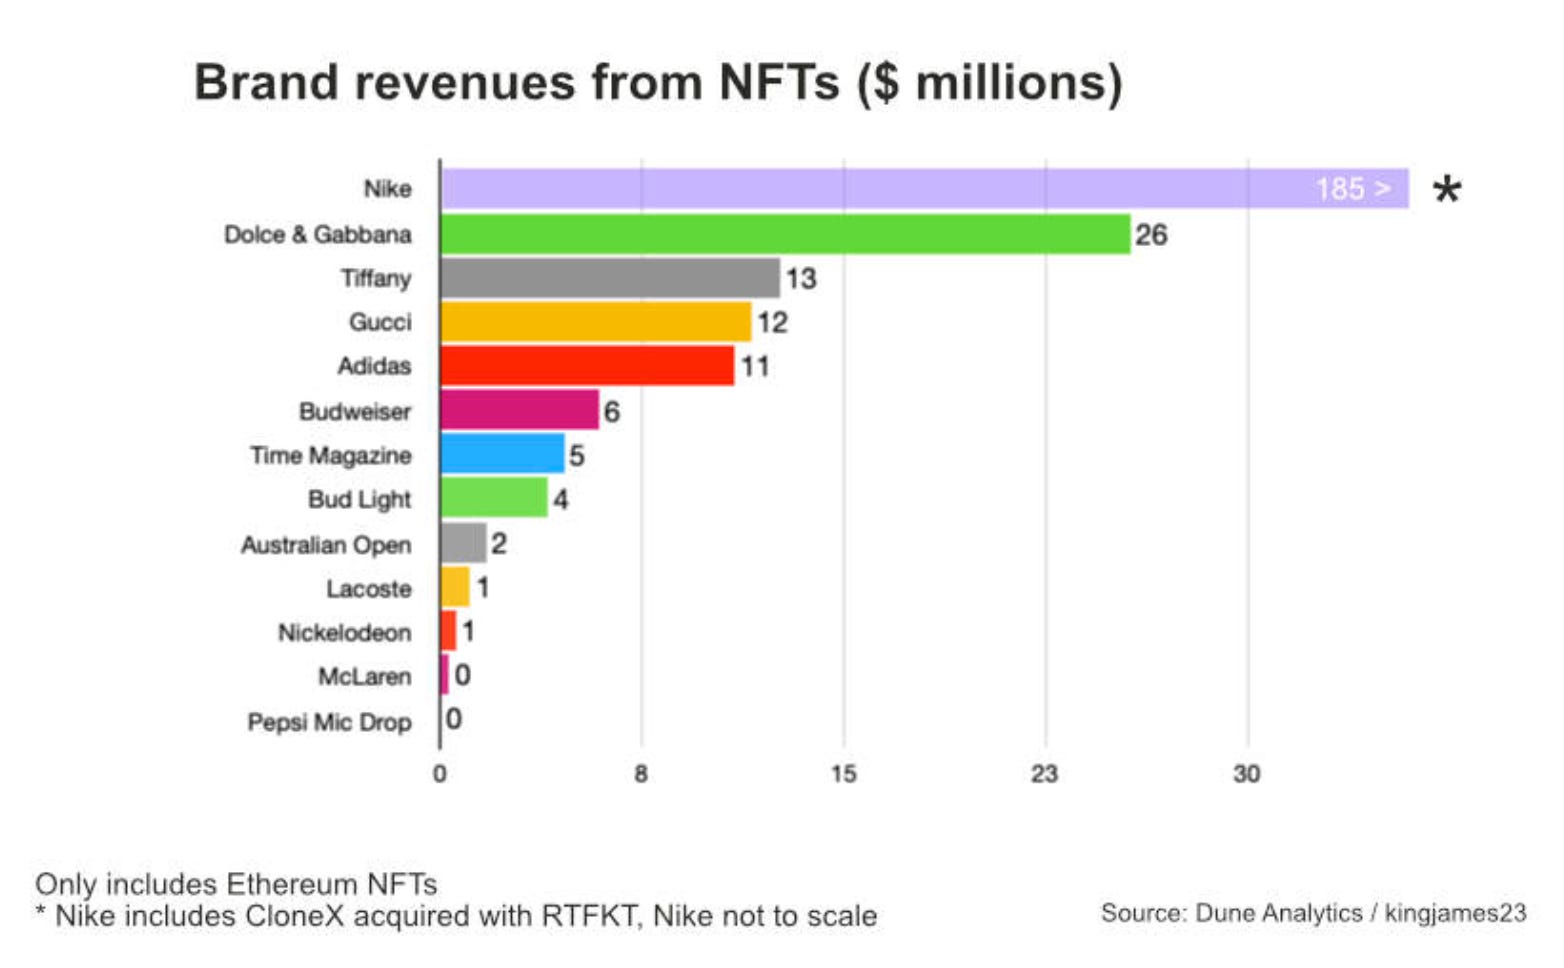
Luxury brands have been playing with NFTs for a while. Gucci was one of the first to partner with a platform to develop 3D clothing as NFTs and many others confirmed to Vogue that they were in the process of completing NFT deals.Last year, Morgan Stanley research forecast that metaverse gaming and NFTs could account for 10% of the luxury sector’s addressable market by 2030, representing a €50 billion opportunity.
The breakdown of NFT minters across all brands skewed towards well-versed NFT users. The largest segment of users has performed between five and forty NFT transactions. Notably, 25.9% of Bud Light’s N3XT owners and 46.6% of Time Magazine NFT owners have track records of over 200 NFT transactions. Ultimately, these revenue figures are minuscule relative to these companies’ global revenues. Even if unprofitable to begin with, these investments are arguably a small price to pay for forging their place in the metaverse and unlocking future critical revenue streams in the virtual world.
Evelyne
================
For more educational crypto content, check out the links below:
The Stakeborg DAO Talks on YouTube: https://www.youtube.com/playlist?list=PLOrFZZifNn4Nx4nSQL3WS52ALPXgrTSVG
Discord channel: https://discord.com/channels/901898461568442458/903006233584341052
StakeborgDAO Quarterly Reports: https://docs.stakeborgdao.com/reports/dao-quarterly-reports
Stakeborg Academy: https://academy.stakeborg.com/
Thank you📝📊🧑🏽💻👍🦾
Thank you as always ! Strong consistency and value !